SPANA for Spectral Data Analyses [About] Copyright (c) 2010 ykuroda All right reserved. |
SPANA for Spectral Data Analyses [About] Copyright (c) 2010 ykuroda All right reserved. |
![]()
![]()
![]()
![]()
![]()
![]()
![]()
1. Introduction
SPANA is a program for analyzing various spectra in the ultraviolet
and visible regions.a) The program itself is written in Microsoft Visual Basic and operates on
standard WINDOWS through normal installation procedures.b) For smooth operation of the program, it is recommended to use a system
with 500MB or more memory.
SPANA reads spectral data written in ASCII code with a fixed resolution
and up to 10001 data points, into a maximum of 500 data channels (Ch.0
- Ch.499) and analyzes these spectra. General spectral data is read by
specifying the data structure for any text file displayed as a "*.*"
type file.c) Spreadsheet-type data can also be read as "*.TAB" files compatible
with Excel's "*.csv" files.d) Data processed by SPANA is saved as "*.DAT", "*.ANA",
"*.HRS", etc.
a) SPANA can handle any 2D data as long as it is numerical data given as
any physical quantity on the vertical axis against a fixed resolution data
on the horizontal axis, even if it's not electronic spectra (ex. chromatography
data).
b) If garbled characters or errors occur on the screen due to differences in standard fonts depending on the WINDOWS version, place the attached fonts for WINDOWS (Arial, MS Sans Serif, MS Serif, WINGDNG3, Symbol) in the WINDOWS-FONTS folder. These fonts can also be integrated into the system on LINUX (Ubuntu + Wine) for it to operate.
c) From Ver. 5.3.73, a function has been added to read variable resolution data by converting and correcting it to SPANA's fixed resolution data.
2.Spectral files that can be handled by SPANA
SPANA identifies spectral data by their file extensions and reads them into the program. The relationship between data files and extensions identified in the current version is as follows.
| Data Type | File Extension |
| General Data File (read only) | |
| Text File written by ASCII Codes (constant and variable resolution) |
* . * a) |
| Data type used by SPANA | |
| SPANA Standard File (1nm resolution) | *.ANA |
| SPANA High Resolution file (0.5nm resolution) | *.HRS |
| SPANA Spreadsheet File (arbitrary (read) 0.5nm (write) resolution) |
*.TAB b) |
| SPANA Universal File (arbitrary (write) multi (read) resolution) |
*.DAT c) |
| SPANA Data File for Least Square Calculation) | *.LSQ |
| Data type of commercial spectrometers | |
| Shimazu UV File | *.UVD |
| Shimazu Time Course File | *.3D |
| Hitachi Fluorescence File | *.FSD |
| Hewlett Packard UV File | *.WAV |
| Hewlett Packard Time Course File | *.TIM |
| JASCO CD File | *.JAC |
| JASCO UV & Fluorescence Text File | *.TXT |
3. The area and the resolution of the spectral data and SPANA
In the default state of SPANA, the data points, the shortest wave length (Base Coordinate) and the resolution of target spectra are max 10001, 180nm and 0.5nm, respectively. Therefore, the range of target spectra must be between 180nm - 5180nm (=180 + 0.5 x 10000). The data having the different resolutions are converted into those of 0.5nm resolution by the function of the cubic spline interpolation.
In order to manage spectra in a different range from the default one, the base coordinate and the resolution must be adjusted by using the File-Settings-Spectrum Settings menu.
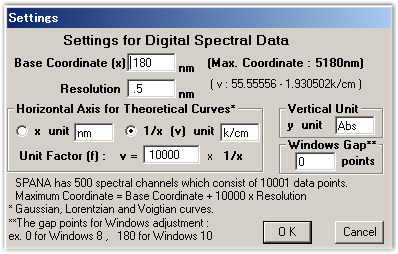
As the results of the adjustments, the spectral range of SPANA becomes as follows.
[Base Coordinate] - [Base Coordinate + Resolution x 10000]
In this mode, the file format readable by SPANA is limited to "*.DAT"
and "*.*" which are applicable for the spectra of arbitrary resolutions.
The resolution of the each spectrum must be written in the spectral files
for the former and assigned during the file reading procedure for the latter.
a)
If, when the base coordinate and/or resolution are changed, there are spectra
which have been already read into SPANA, the spectra are converted into
those of the newly assigned base coordinate and resolution by the function
of the cubic spline interpolation. In the case that the resolutions of
SPANA and the new reading spectrum are different, the spectrum is also
converted into that of the resolution of SPANA. Thus, SPANA can handle,
display and analyze spectra having different resolutions consistently.b)
a) Since, if there is no consistency between the ranges of SPANA and the
spectrum, SPANA generates program errors, the user needs to understand
these relationships to change the base coordinate and resolution.
b) The spline interpolation of the spectrum is based on the method of applying
the cubic function to the spectrum where the errors between the data and
theoretical values are usually considered to be small enough, though too
large difference between resolutions of SPANA and the data can possibly
result in a significant spectral distortion.
4. Numerical Operation in SPANA
SPANA performs following arithmetic operations for the spectral data.
a) Addition, subtraction, multiplication,
and division of a constant value
b) Addition, subtraction, multiplication,
and division between two spectra
c) Reverse, exponential and logarithmic transformation
d) Normalization
e) Differentiation and integration
f) Smoothing, Baseline estimation (BEADS)
g) Wave length shift
h) Estimation of the spectral area and overlapped
area between two spectra
etc.
5. Display of Spectra
SPANA provides the following functions for display of spectra
a) Setting of display area (strength and
wave length axes)
(While SPANA usually sets the
absorbance unit as the vertical axis and the wave
length unit as the horizontal
axis, these units are arbitrarily changeable.)
b) Setting of the scales and grid for the
vertical and horizontal axes
c) Color setting for displayed spectra
d) Change of the horizontal axis from the
wave length mode to the wave number mode
e) Print out and output the bitmap files
of the displayed spectra
(in ver.5, including the print-out function for virtual printers such
as the PDF one)
f) 3D-display of the multiple spectral data set
6. Analysis and Graphing Functions of SPANA
SPANA performs the following analyses on the loaded spectral data.
a) Analysis by applying titration and kinetic models described in the Analyses section.
b) Graphical display of the measured data and theoretical curves as a result of the analysis.
c) Calculation and graphical display of changes in concentration of chemical
species based on the results of the analysis.
(Including inverse and logarithmic transformations of the vertical
and horizontal axes of the graphical representation.)
d) Estimation of spectra of intermediates and complexes of titration based on the analysis results.
e) Wave separation of spectra.
Otherwise, SPANA has the functionality of a least-squares optimisation
platform for general data with a theoretical value calculation function
defined by the user as an external program.